
FiberLink · Android
FiberLink - Loss plan & test
Plan the network.
Verify the build.
Fiber network planning and field diagnosis, together on your phone.
Build your GPON or FTTH design, calculate the optical loss, then compare real meter readings with the plan. Leave the site with a report that shows both.
Free download · Contains ads · Core tools work offline
FTTH installers · GPON technicians · Network planners
From design to field report
One workflow.
Every stage of the job.
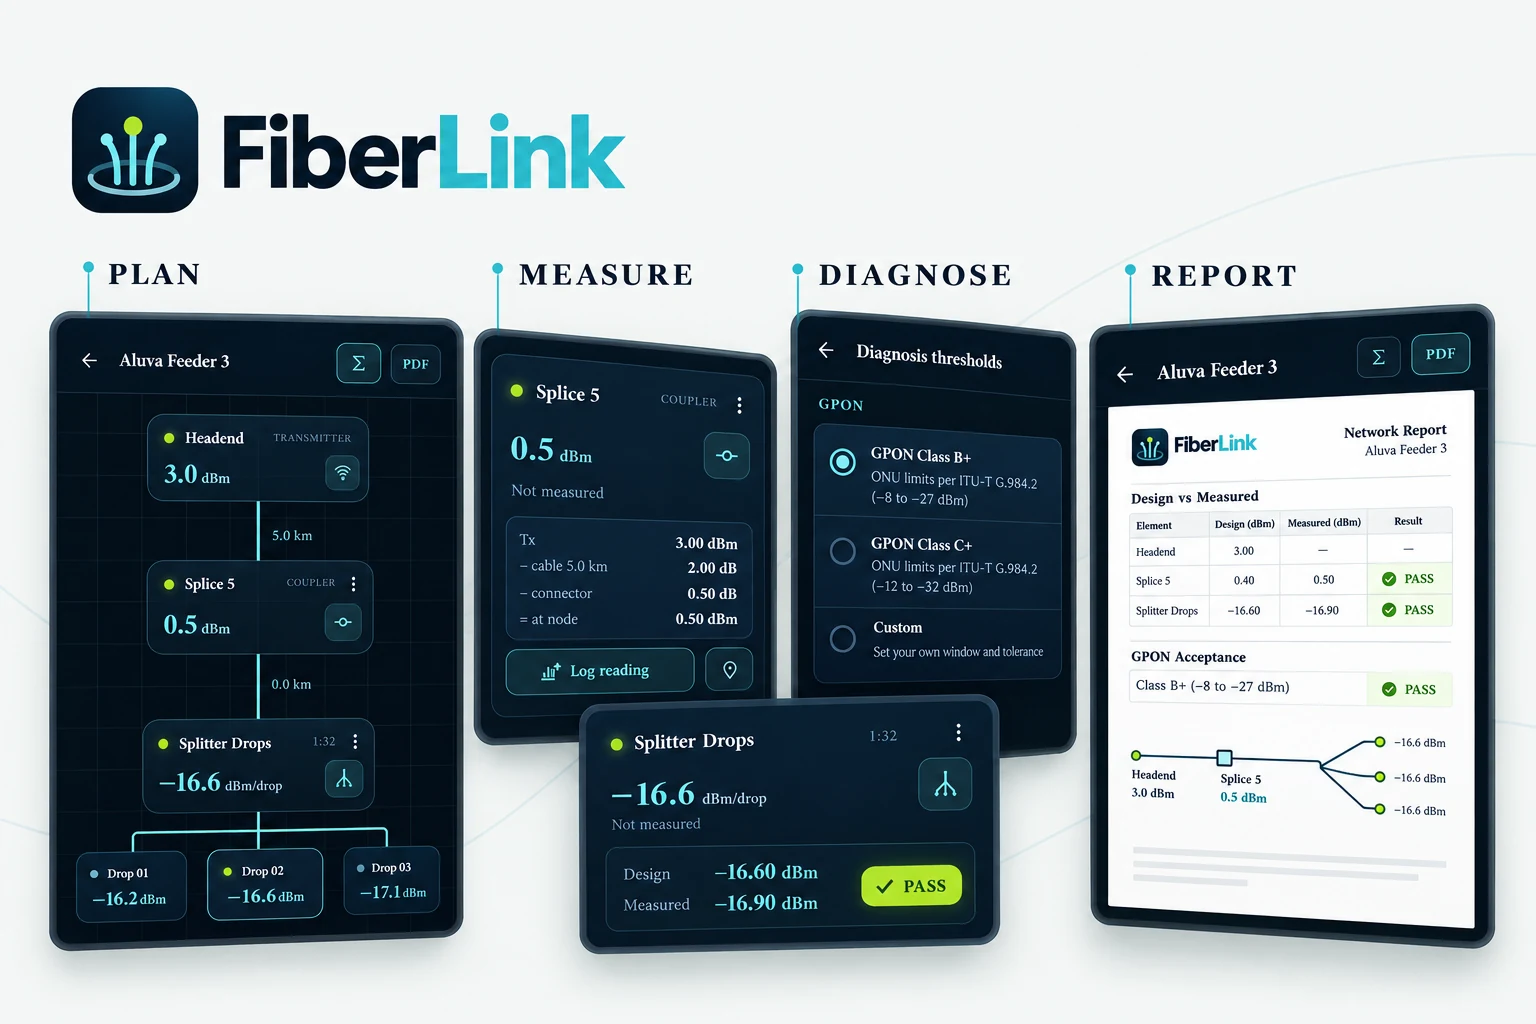
Use the same network plan before the install, during testing and at handoff.
Plan
Lay out the network and inspect the expected power at each node.
Measure
Take an optical power-meter reading and log it against the right node.
Diagnose
Check the difference from design and the endpoint receiver window.
Report
Export the design and measured results in a PDF for your team or client.
Field diagnosis
A reading is useful.
Knowing what it means is better.
FiberLink separates two questions: does the measured power match the design, and can the endpoint receiver work with it?
- Design driftA difference from the prediction can help identify excess upstream loss, such as a poor splice or dirty connector.
- Receiver rangeAt endpoints, check whether the measured power falls inside your configured operating window.
Endpoint / Drop 01
- Design predicts
- −16.60 dBm
- Meter reading
- −16.90 dBm
- Difference from design
- −0.30 dB
Illustration using a 2 dB tolerance and a −27 to −8 dBm receiver window. Results depend on your readings and selected criteria.
Practical tools for the field
The details that make the job easier.
Visual network planning
Model transmitters, cable spans, couplers and splitter branches. Expand individual drops when you need a closer look.
Transparent loss calculations
See how fiber attenuation, connector loss and split ratios affect the power at each node.
Live reading diagnosis
Enter a reading from your optical power meter. Pass, marginal and fail feedback updates as you type.
GPON presets and custom limits
Choose Field target, GPON Class B+ or Class C+, or set your own receiver window and design tolerance.
Optional location tags
Attach a GPS location when you log a reading and open a tagged node in Google Maps.
Reports with field evidence
Export a PDF with the network design, measured values, diagnosis status, locations and the criteria used.
Inside FiberLink
See the tools you’ll work with.
All eight English store visuals.
Selected location details removed. Select to enlarge.
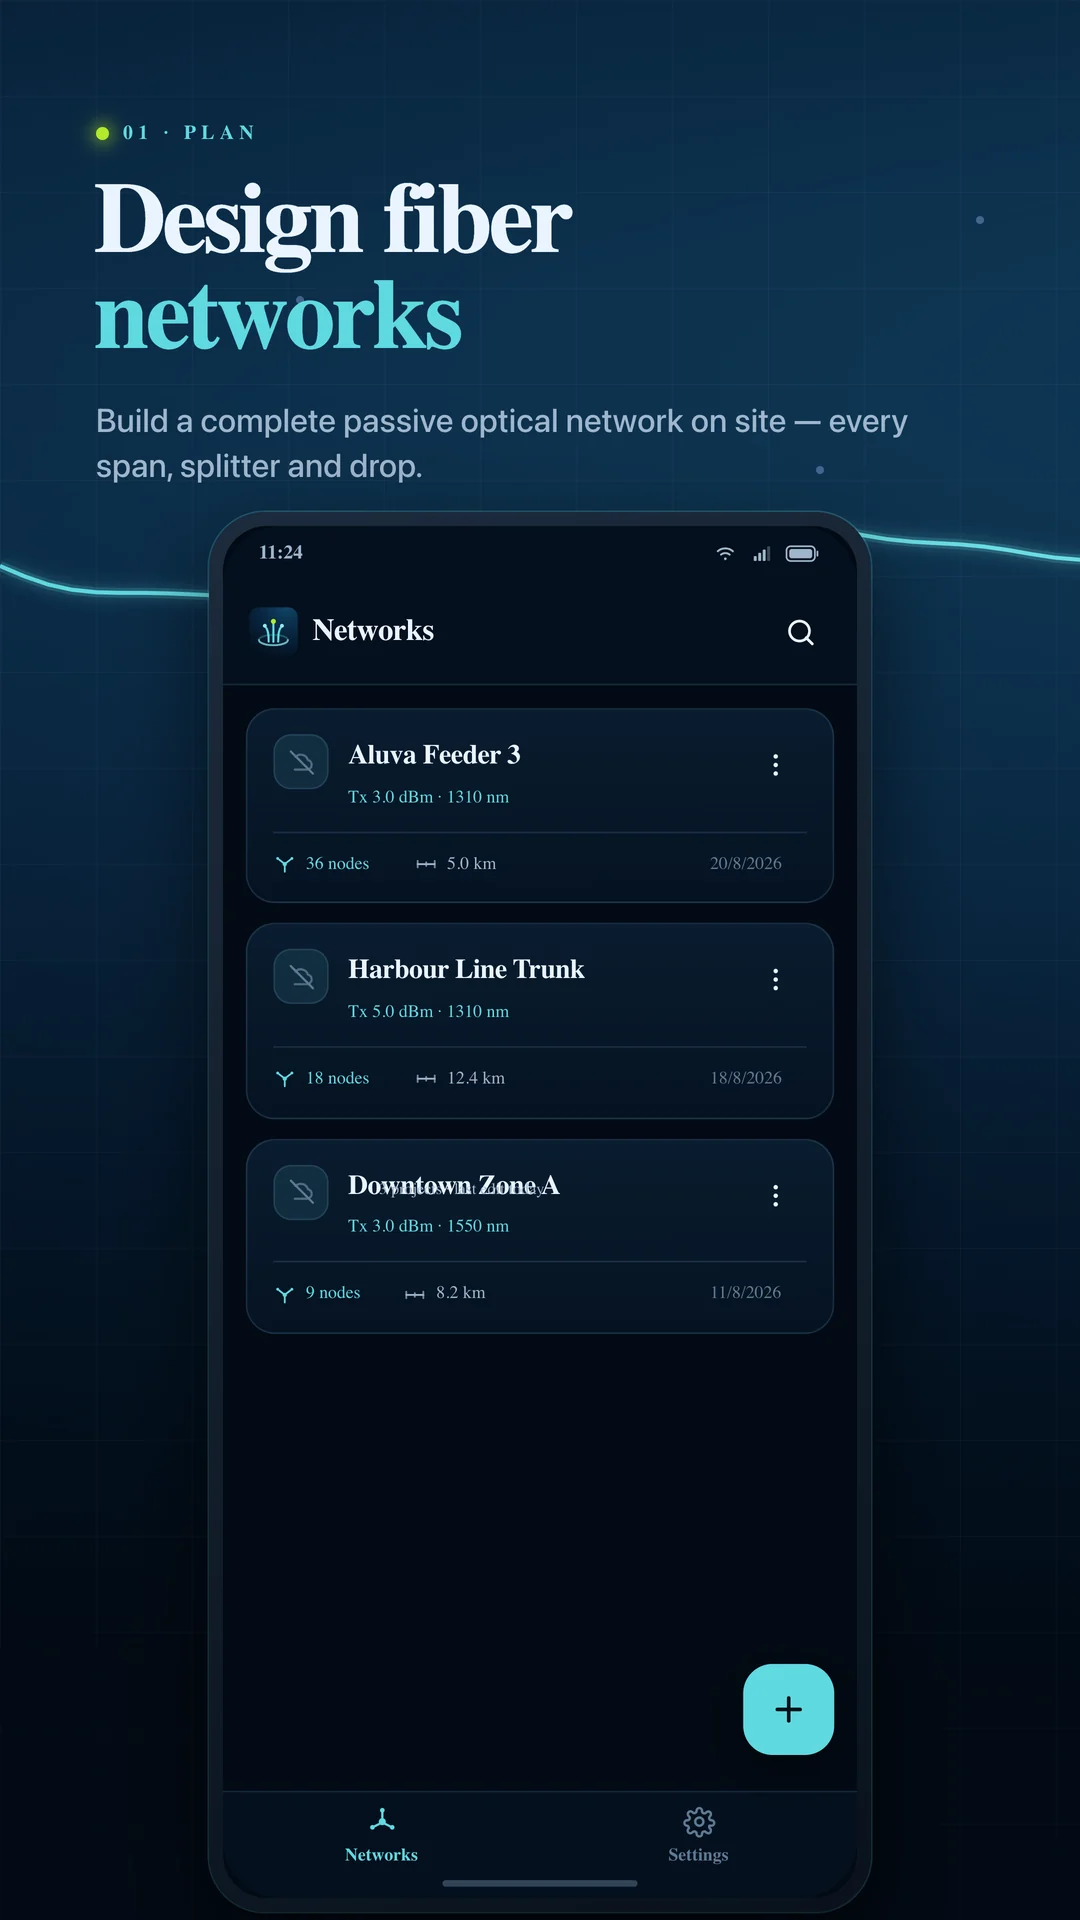
Keep your jobs organized
Return to saved networks with the transmitter, node count and distance at a glance.
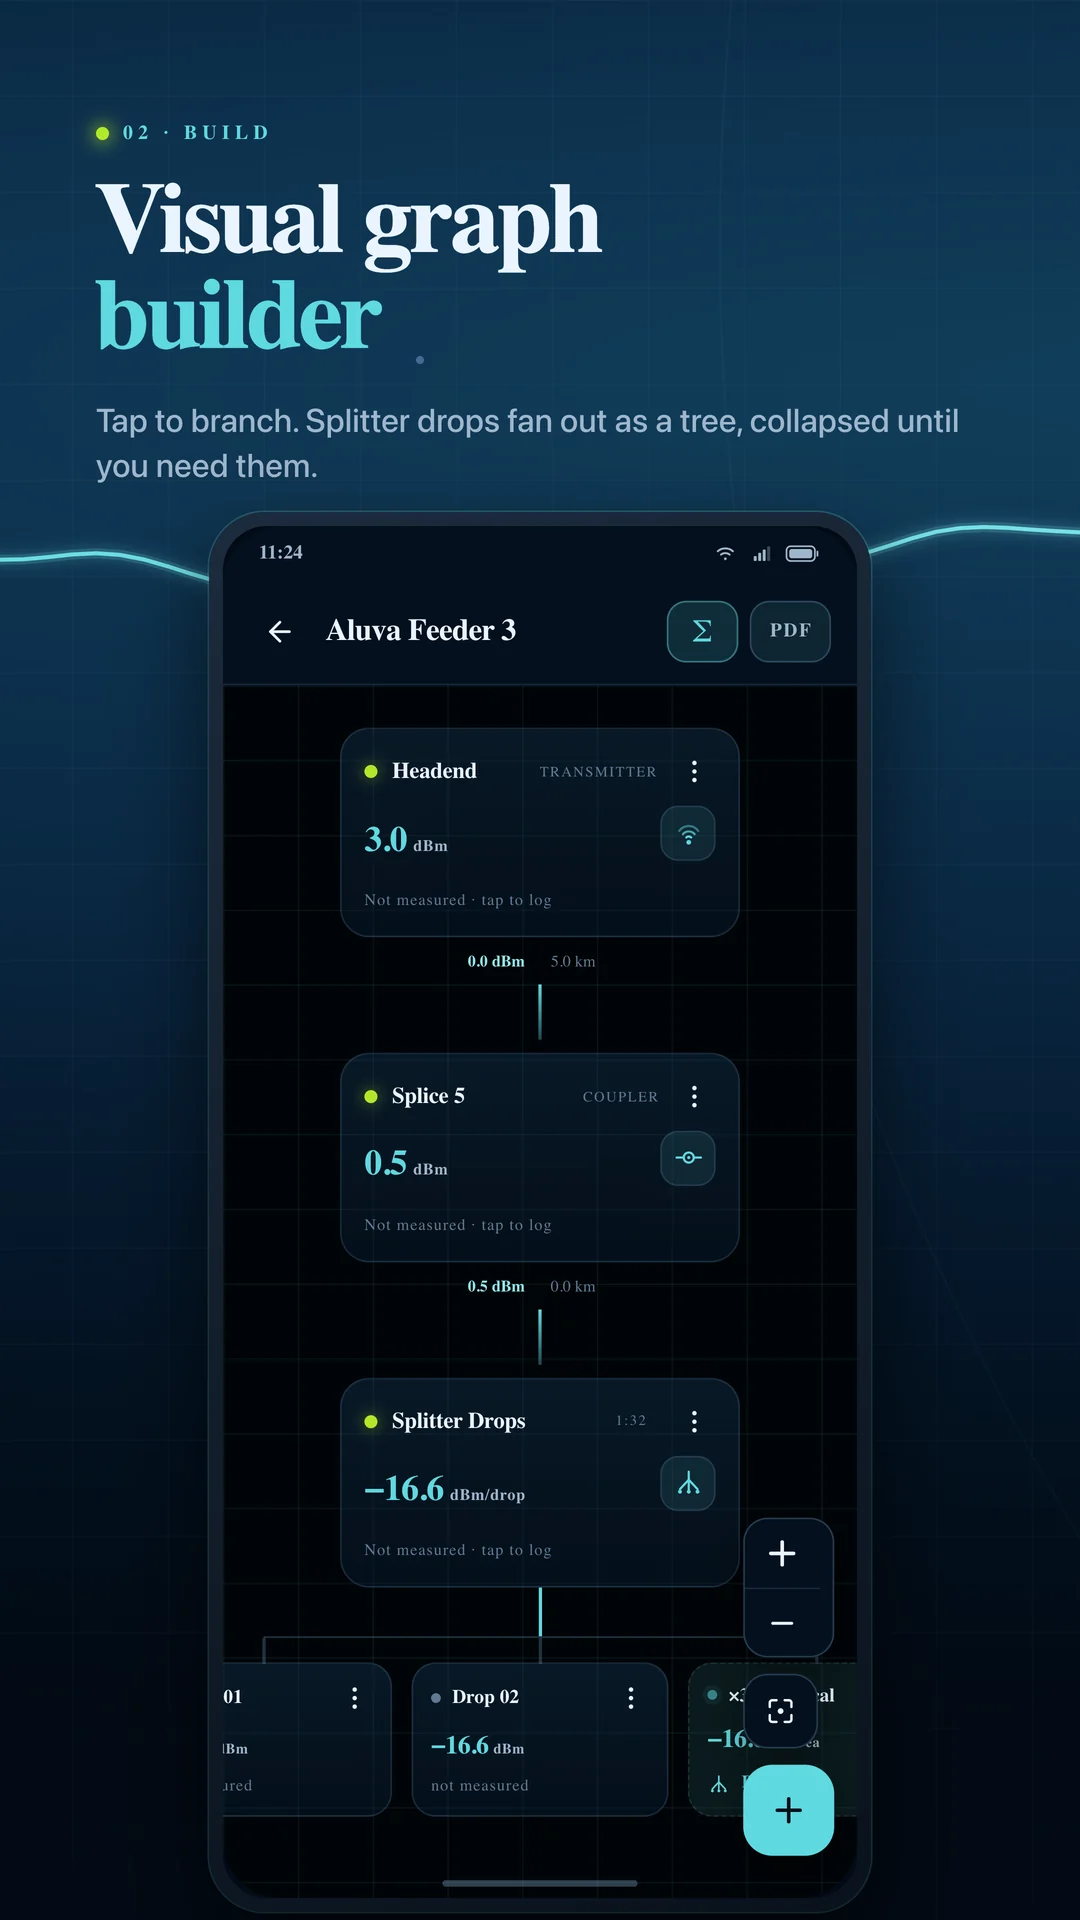
Build the network
Keep the headend, spans and splitter drops connected in one visual plan.
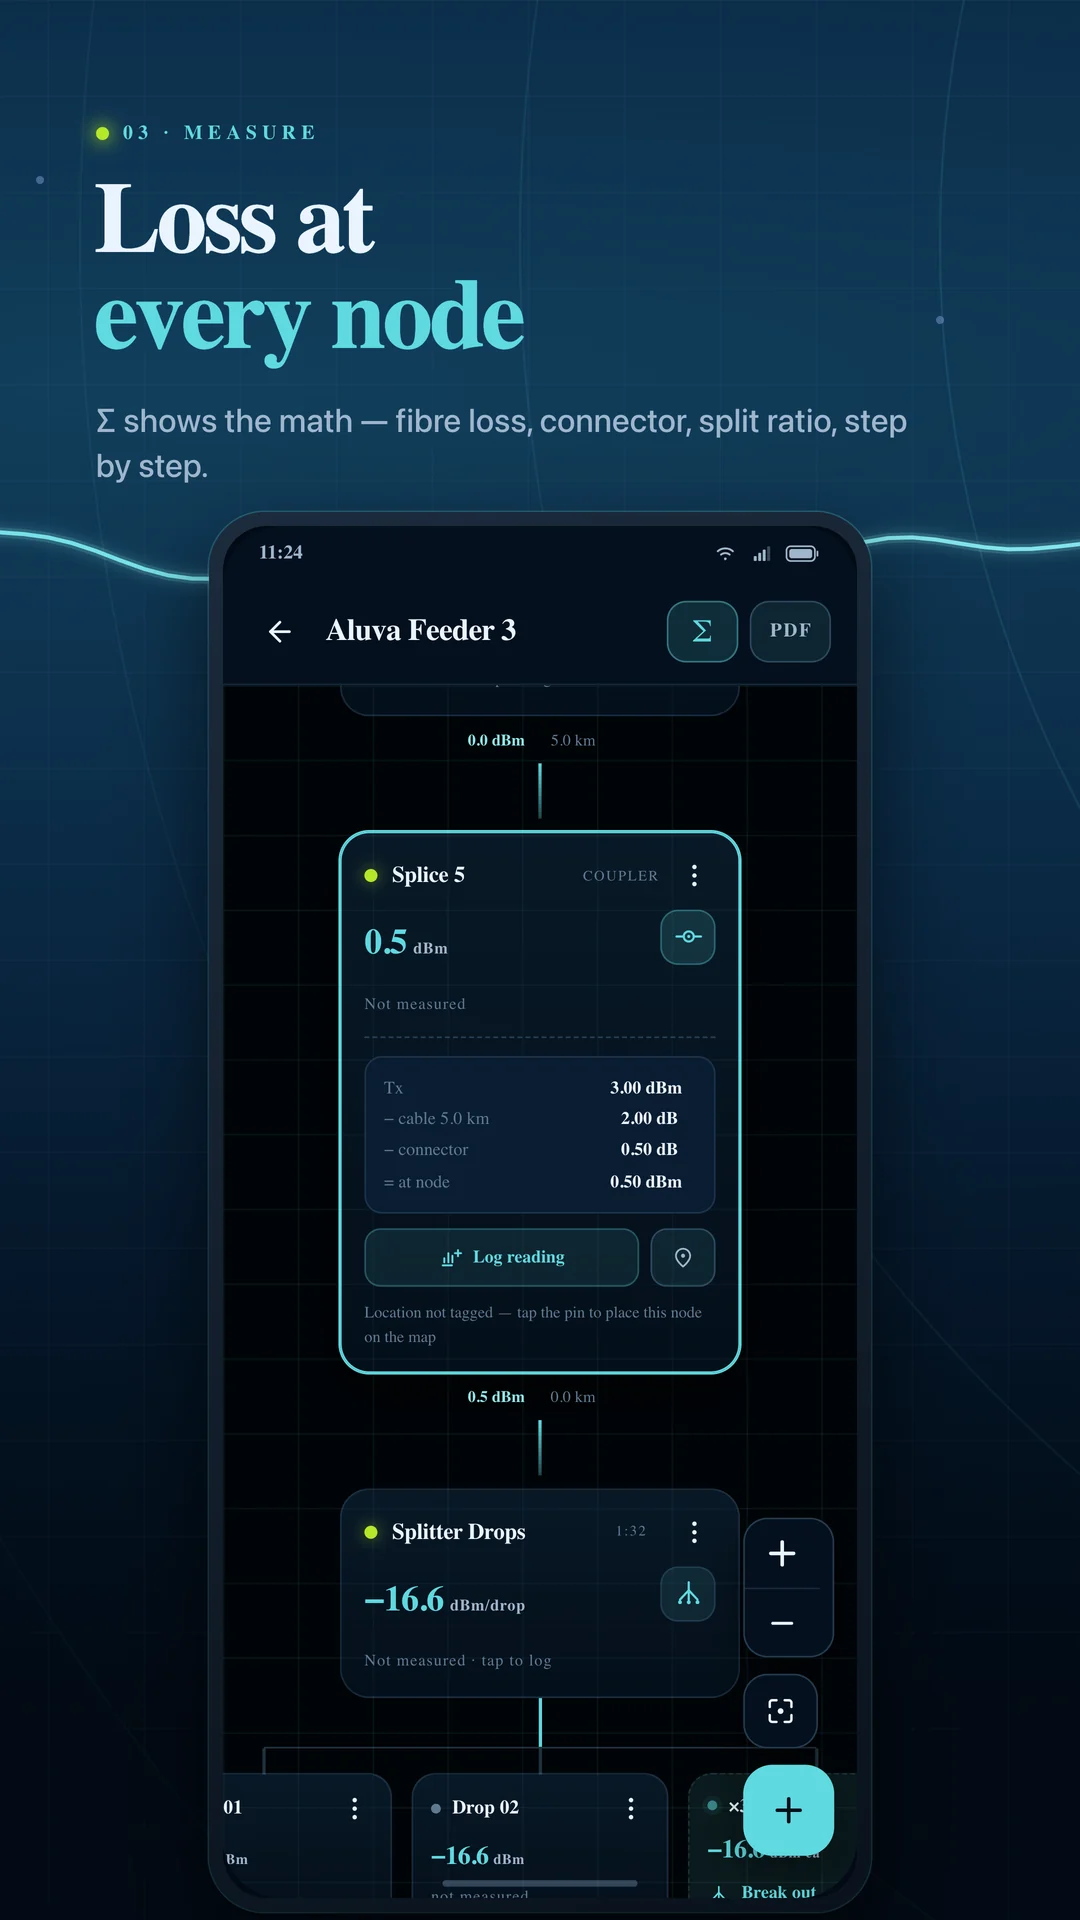
See the calculation
Inspect the power calculation at each coupler instead of working backwards from a final number.
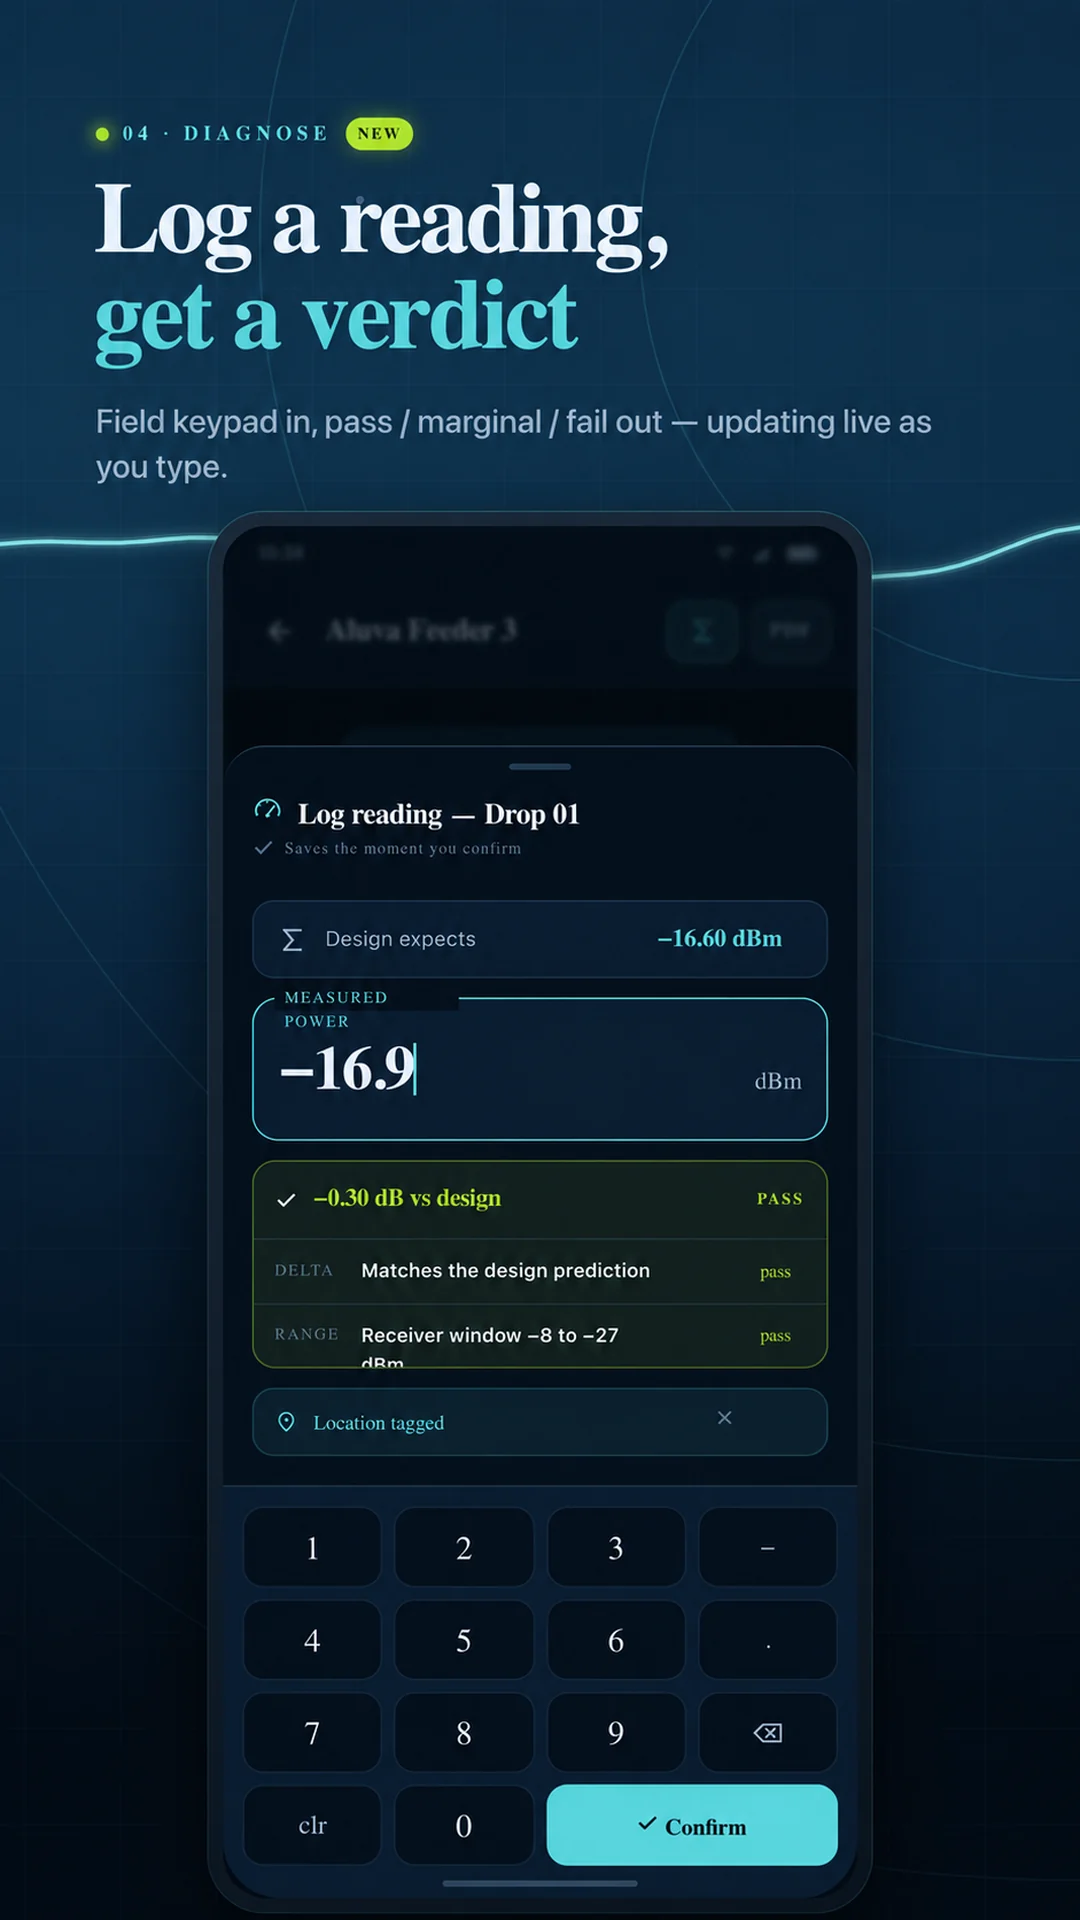
Log a meter reading
Enter measured optical power with the field keypad and see the verdict update as you type.
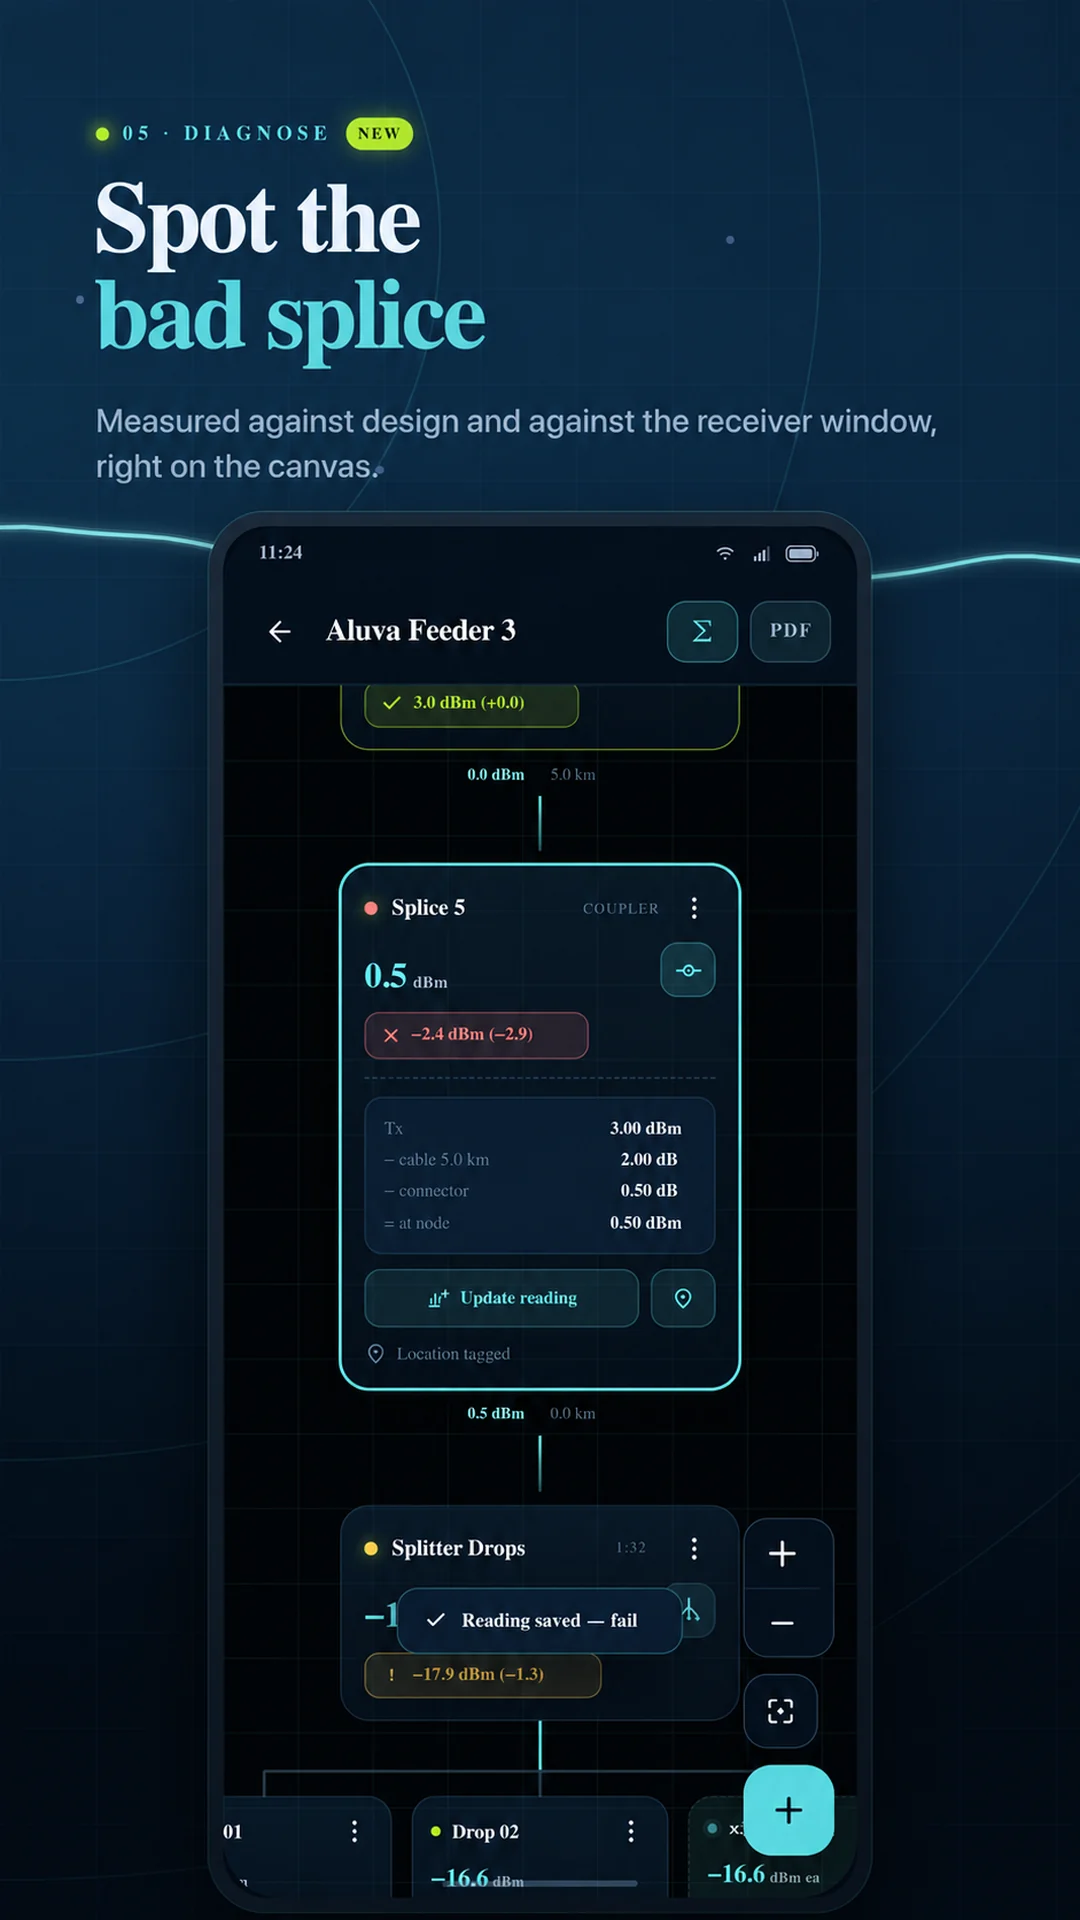
Investigate excess loss
Follow measured results through the network to investigate where actual loss differs from the plan.
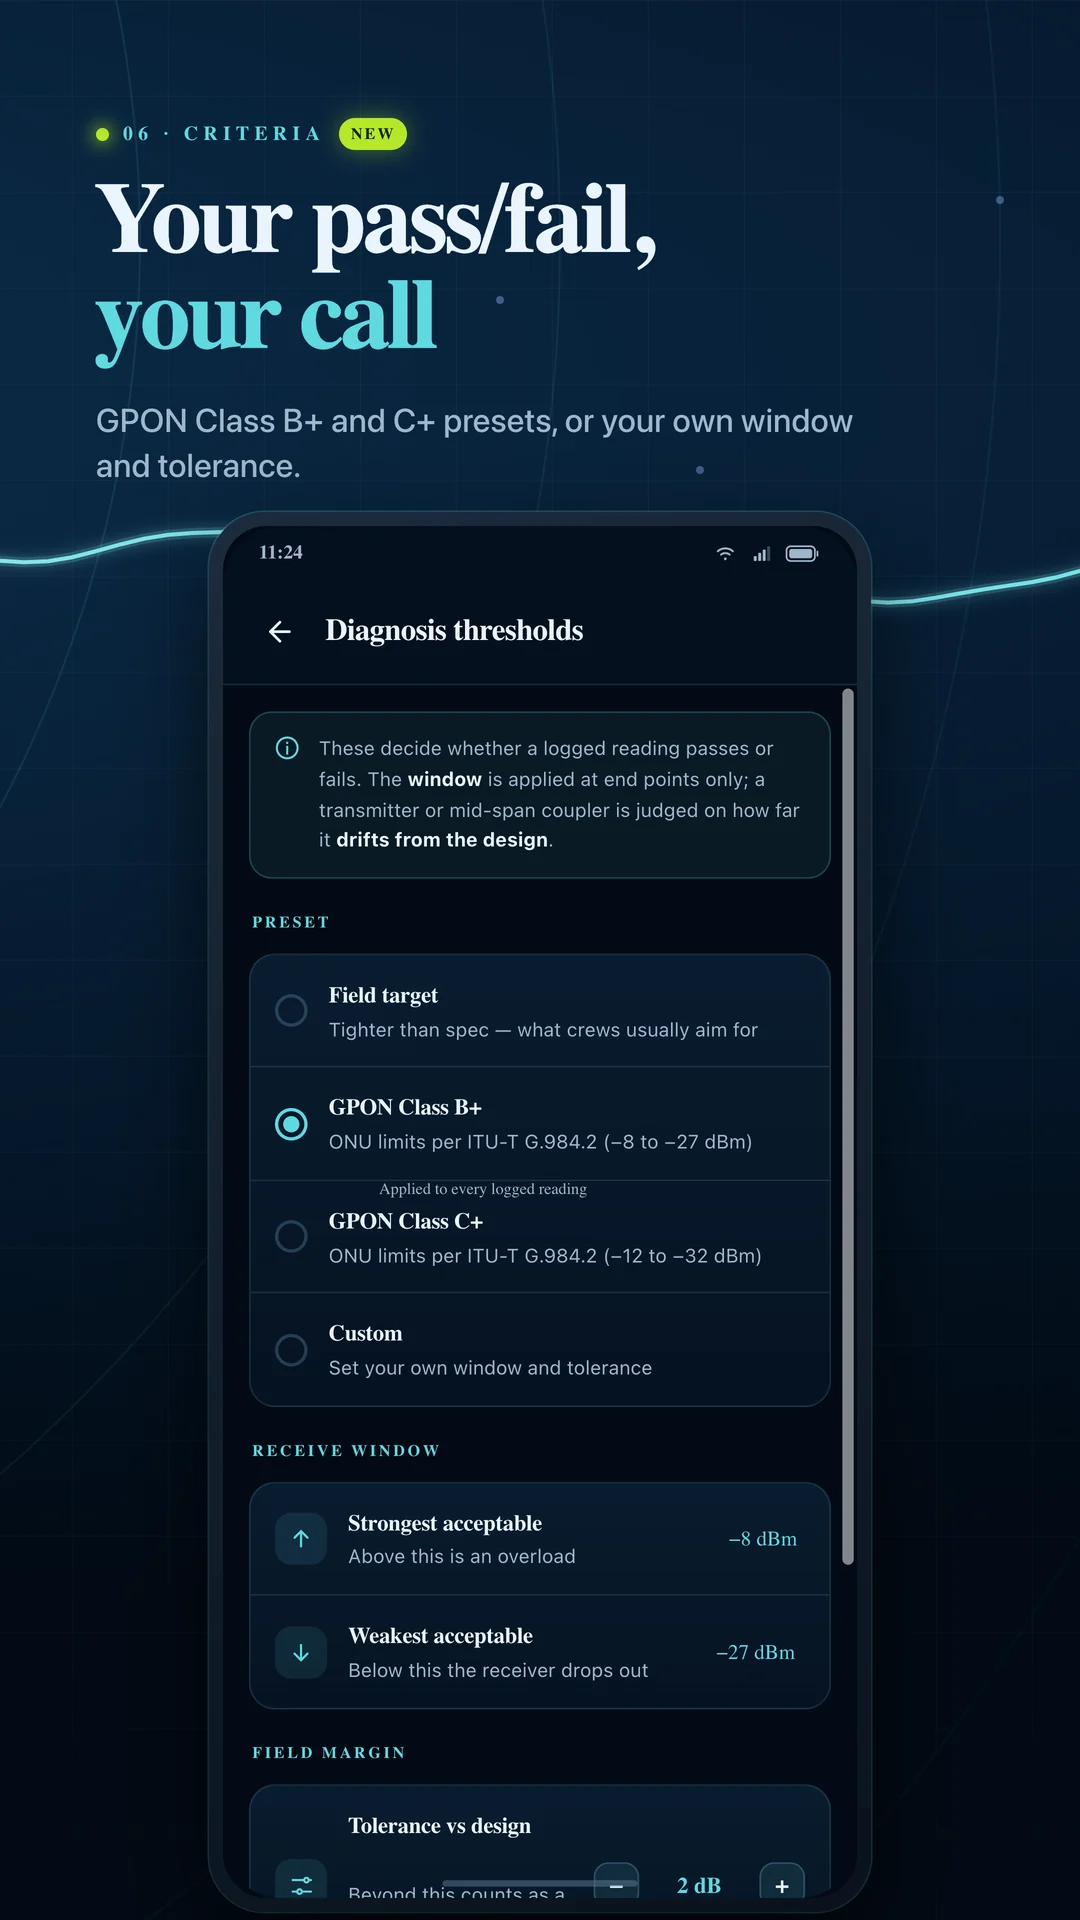
Set your acceptance criteria
Choose a preset or define the receiver window and tolerance your job needs.

Keep readings tied to the site
Optionally tag a node’s location and work in a light theme when conditions call for it.
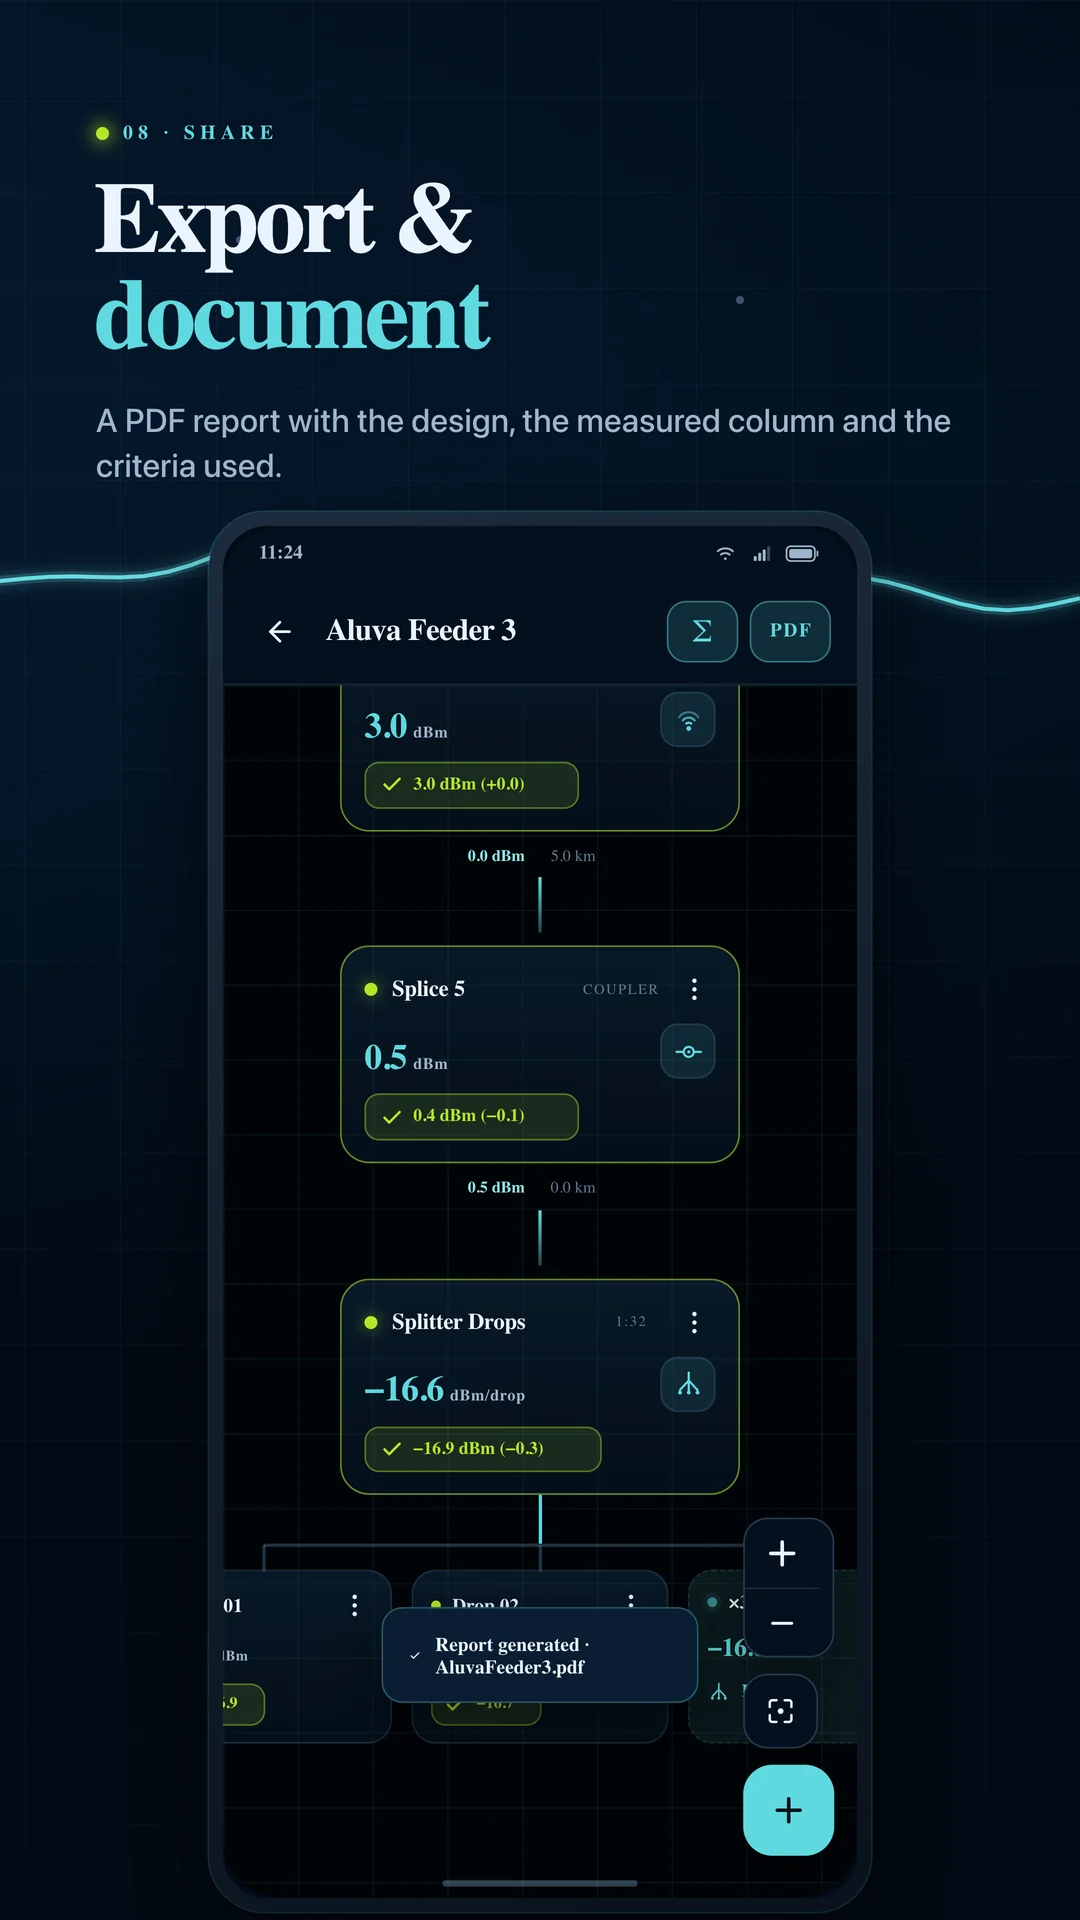
Document the result
Carry the design, measurements and diagnosis criteria into your handoff.
Before you install
A few useful answers.
Does FiberLink measure optical power?
You take the measurement with an optical power meter and enter the reading in FiberLink. The app compares it with the calculated design and your configured acceptance criteria.
Can I use it without a connection?
Network planning, loss calculations, reading diagnosis and PDF export work offline. Opening Google Maps or Google Play uses an external service.
What does the diagnosis check?
Design drift compares a measured value with the predicted power at that node. The receiver-window check applies to endpoints. Transmitters and mid-span components are judged against the design, rather than an endpoint receiver window.
Is it available for my device?
FiberLink is available for Android on Google Play. It is free to download and contains ads.
Ready for your next site visit
Take your design into the field.
Plan a network. Log a reading. Share the result.
Android · Free download · Contains ads